POSTER PRESENTATION
Published on November 19, 2019
EXHIBIT 99.1
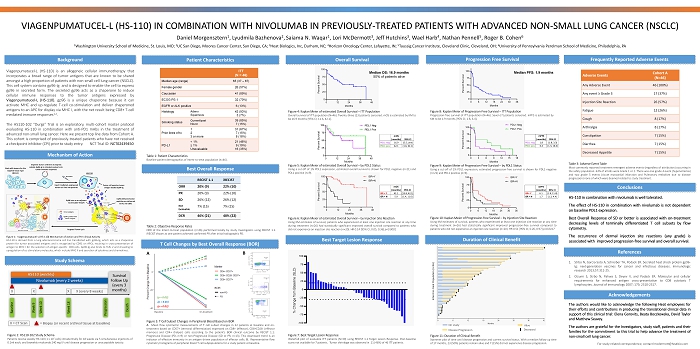
VIAGENPUMATUCEL - L (HS - 110) IN COMBINATION WITH NIVOLUMAB IN PREVIOUSLY - TREATED PATIENTS WITH ADVANCED NON - SMALL LUNG CANCER (NSC LC) Daniel Morgensztern 1 , Lyudmila Bazhenova 2 , Saiama N. Waqar 1 , Lori McDermott 3 , Jeff Hutchins 3 , Wael Harb 4 , Nathan Pennell 5 , Roger B. Cohen 6 1 Washington University School of Medicine, St. Louis, MO; 2 UC San Diego, Moores Cancer Center, San Diego, CA; 3 Heat Biologics, Inc, Durham, NC; 4 Horizon Oncology Center, Lafayette, IN; 5 Taussig Cancer Institute, Cleveland Clinic, Cleveland, OH; 6 University of Pennsylvania Perelman School of Medicine, Philadelphia, PA Background Acknowledgements The authors would like to acknowledge the following Heat employees for their efforts and contributions in producing the translational clinical data in support of this clinical trial : Elena Gorovits, Beata Boczkowska, David Taylor and Matthew Seavey . The authors are grateful for the Investigators, study staff, patients and their families for the commitment to this trial to help advance the treatment of non - small cell lung cancer . Patient Characteristics T Cell Changes by Best Overall Response (BOR) Best Target Lesion Response Viagenpumatucel - L (HS - 110 ) is an allogeneic cellular immunotherapy that incorporates a broad range of tumor antigens that are known to be shared amongst a high proportion of patients with non - small cell lung cancer (NSCLC) . This cell system contains gp 96 - Ig and is designed to enable the cell to express gp 96 in secreted form . The secreted gp 96 acts as a chaperone to induce cellular immune responses to the tumor antigens expressed by Viagenpumatucel - L (HS - 110 ) . gp 96 is a unique chaperone because it can activate MHC and up - regulate T - cell co - stimulation and deliver chaperoned antigens to an APC for display via MHC I, with the net result being CD 8 + T - cell mediated immune responses 1 , 2 . The HS 110 - 102 “Durga” Trial is an exploratory, multi - cohort master protocol evaluating HS - 110 in combination with anti - PD 1 mAbs in the treatment of advanced non - small lung cancer . Here we present top line data from Cohort A . This cohort is comprised of previously - treated patients who have not received a checkpoint inhibitor (CPI) prior to study entry . NCT Trial ID : NCT 02439450 References 1. Strbo N, Garcia - Soto A, Schreiber TH, Podack ER . Secreted heat shock protein gp 96 - Ig : next - generation vaccines for cancer and infectious diseases . Immunologic research 2013 ; 57 : 311 - 25 . 2. Oizumi S, Strbo N, Pahwa S, Deyev V, and Podack ER . Molecular and cellular requirements for enhanced antigen cross - presentation to CD 8 cytotoxic T lymphocytes . Journal of immunology 2007 ; 179 , 2310 - 2317 . Study Schema Overall Survival Conclusions Figure 2 : HS 110 - 102 Study Schema Patients receive weekly HS - 110 ( 1 x 10 7 cells) intradermally for 18 weeks via 5 simultaneous injections of 0 . 1 ml each, and biweekly nivolumab 240 mg IV until disease progression or unacceptable toxicity . Table 1 : Patient Characteristics Baseline patient demographics of Intent - to - treat population (n= 46 ) . Frequently Reported Adverse Events Mechanism of Action Figure 1 : Viagenpumatucel - L (HS - 110 ) Mechanism of Action and Pre - clinical Activity HS - 110 is derived from a lung adenocarcinoma cell line transfected with gp 96 - Ig, which acts as a chaperone protein for tumor associated antigens and is recognized by CD 91 on APCs, resulting in cross - presentation of antigen to MHC I for the selection of antigen - specific CD 8 cells . Gp 96 - Ig also binds to TLRs 2 and 4 leading to upregulation of co - stimulatory molecules, which include MHC II and secretion of cytokines and chemokines . HS - 110 in combination with nivolumab is well tolerated . The effect of HS - 110 in combination with nivolumab is not dependent on baseline PDL 1 expression . Best Overall Response of SD or better is associated with on - treatment decreasing levels of terminally differentiated T cell subsets by flow cytometry . The occurrence of dermal injection site reactions (any grade) is associated with improved progression - free survival and overall survival . ITT (N = 46) Median age (range) 65 (37 – 87) Female gender 26 (57%) Caucasian 41 (89%) ECOG PS 1 32 (70%) EGFR or ALK positive 6 (13%) Histology Adeno Squamous 43 (93%) 3 (7%) Smoking status Current/past Never 39 (85%) 7 (15%) Prior lines of tx 1 2 3 or more 31 (67%) 7 (15%) 8 (18%) PD - L1 < 1% ≥ 1% Unevaluable 21 (46%) 9 (19%) 16 (35%) Duration of Clinical Benefit Figure 7 : Best Target Lesion Response Waterfall plot of evaluable ITT patients (N= 39 ) using RECIST 1 . 1 Target Lesion Response . Post - baseline scans not available for 7 patients . Tumor shrinkage was observed in 21 ( 46 % ) of 46 ITT patients . Figure 11 : Duration of Clinical Benefit Swimmer plot of time until disease progression and current survival status . With a median follow up time of 17 months, 23 ( 50 % ) patients remain alive and 7 ( 15 % ) did not experience disease progression . On study Disease Progression Alive Deceased For study - related correspondence, contact lmcdermott@heatbio.com Figure 4 : Kaplan Meier of estimated Overall Survival – ITT Population Overall survival of ITT population (N= 46 ) . Twenty - three ( 23 ) patients censored . mOS is estimated by KM to be 16 . 9 months [ 95 % CI ; 11 . 6 , 42 . 1 ] . Median OS: 16.9 months 50% of patients alive Table 3 : Adverse Event Table Most commonly reported treatment - emergent adverse events (regardless of attribution) occurring in the safety population . 63 % of all AEs were Grade 1 or 2 . There was one grade 4 event (hyponatremia) and two grade 5 events (Acute myocardial infarction and Pulmonary embolism due to disease progression) none of which were deemed related to study treatment . Table 2 : Objective Response Rates ORR of the Intent - to - treat population (n= 46 ) performed locally by study Investigators using RECIST 1 . 1 . iRECIST shown as one patient achieved confirmed PR after initial radiographic PD . Adverse Events Cohort A (N=46) Any Adverse Event 46 (100%) Any event ≥ Grade 3 17 (37%) Injection Site Reaction 26 (57%) Fatigue 12 (26%) Cough 8 (17%) Arthralgia 8 (17%) Constipation 7 (15%) Diarrhea 7 (15%) Decreased Appetite 7 (15%) RECIST 1.1 iRECIST ORR 20% (9) 22% (10) PR 20% (9) 22% (10) SD 26% (12) 26% (12) Not Evaluable 7% (15) 7% (15) DCR 46% (21) 48% (22) Intent - to - treat Population (n=46) Figure 5 : Kaplan Meier of estimated Overall Survival – by PDL 1 Status Using a cut - off of 1 % PDL 1 expression, estimated overall survival is shown for PDL 1 negative (n= 21 ) and PDL 1 positive (n= 9 ) . Figure 6 : Kaplan Meier of estimated Overall Survival – by Injection Site Reaction Using KM estimates of survival, patients who experienced at least one injection site reaction at any time during treatment (n= 26 ) had statistically significant improved overall survival compared to patients who did not experience an injection site reaction (n= 20 ) . HR 0 . 14 [ 95 % CI ; 0 . 05 , 0 . 36 ] p< 0 . 0001 Progression Free Survival Median PFS: 1.9 months Figure 8 : Kaplan Meier of Progression - Free Survival – ITT Population Progression - free survival of ITT population (N= 46 ) . Seven ( 7 ) patients censored . mPFS is estimated by KM to be 1 . 9 months [ 95 % CI ; 1 . 8 , 6 . 4 ] . Figure 9 : Kaplan Meier of Progression - Free Survival – by PDL 1 Status Using a cut - off of 1 % PDL 1 expression, estimated progression - free survival is shown for PDL 1 negative (n= 21 ) and PDL 1 positive (n= 9 ) . Figure 10 : Kaplan Meier of Progression - free Survival – by Injection Site Reaction Using KM estimates of survival, patients who experienced at least one injection site reaction at any time during treatment (n= 26 ) had statistically significant improved progression - free survival compared to patients who did not experience an injection site reaction (n= 20 ) . HR 0 . 51 [ 95 % CI ; 0 . 26 , 0 . 97 ] p= 0 . 0417 Best Overall Response Figure 3 : T Cell Subset Changes in Peripheral Blood Based on BOR A . Mean flow cytometric measurements of T cell subset changes in 22 patients at baseline and on - treatment based on CD 57 + (terminal differentiation) expressed on CD 8 + (effector), CD 8 +CD 28 - (effector memory) and CD 4 + (helper) cells according to the patient’s BOR clinical outcome by RECIST 1 . 1 : Progressive Disease (PD, n= 9 ) or non - Progressive Disease (SD or PR, n= 13 ) . This downward trend is an indicator of effective immunity in an antigen driven population of effector cells . B . Representative flow cytometry histograms of peripheral blood T cell subpopulations for a study patient at baseline . (p = 0.02) (p = 0.02) (p = 0.01) A B mOS (months) 95% CI PDL1 neg 16.9 (5.5, unk) PDL1 pos 42.1 (1.6, 42.1) mPFS (months) 95% CI PDL1 neg 1.8 (1.8, 3.3) PDL1 pos 6.4 (1.3, 16.4) mOS (months) 95% CI ISR = Y 42.1 (15.8, 42.1) ISR = N 5.9 (1.4, 11.6) mPFS (months) 95% CI ISR= Y 6.1 (1.8, 11.8) ISR = N 1.7 (1.3, 4.4)